
AI-Powered Diagnostic Copilot
Real-time AI diagnostic assistant analyzes live console stack traces, network failures, and DOM mutations to pinpoint root causes and generate instant, copy-ready code fixes.
Connect directly to any remote user session in 1 second. Remotely click, type, inspect live DOM, review Chrome on macOS Console & Network DevTools, and get instant AI-Powered root-cause diagnostics with sub-10ms latency and 0 bytes cloud data retention.
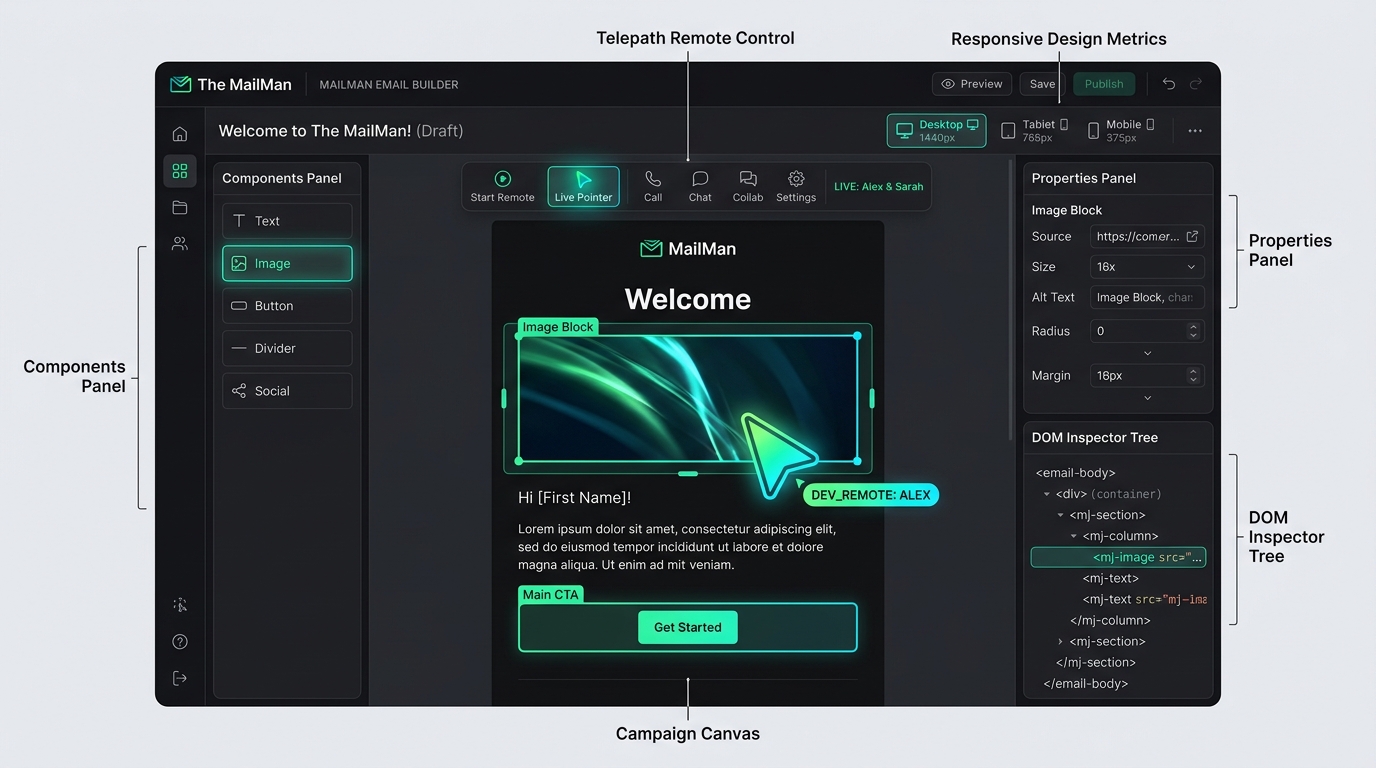
Single-fire click dispatching, native text typing sync (React 18 & Vue 3), radio/checkbox toggle, smooth scroll, and real-time Dev cursor.
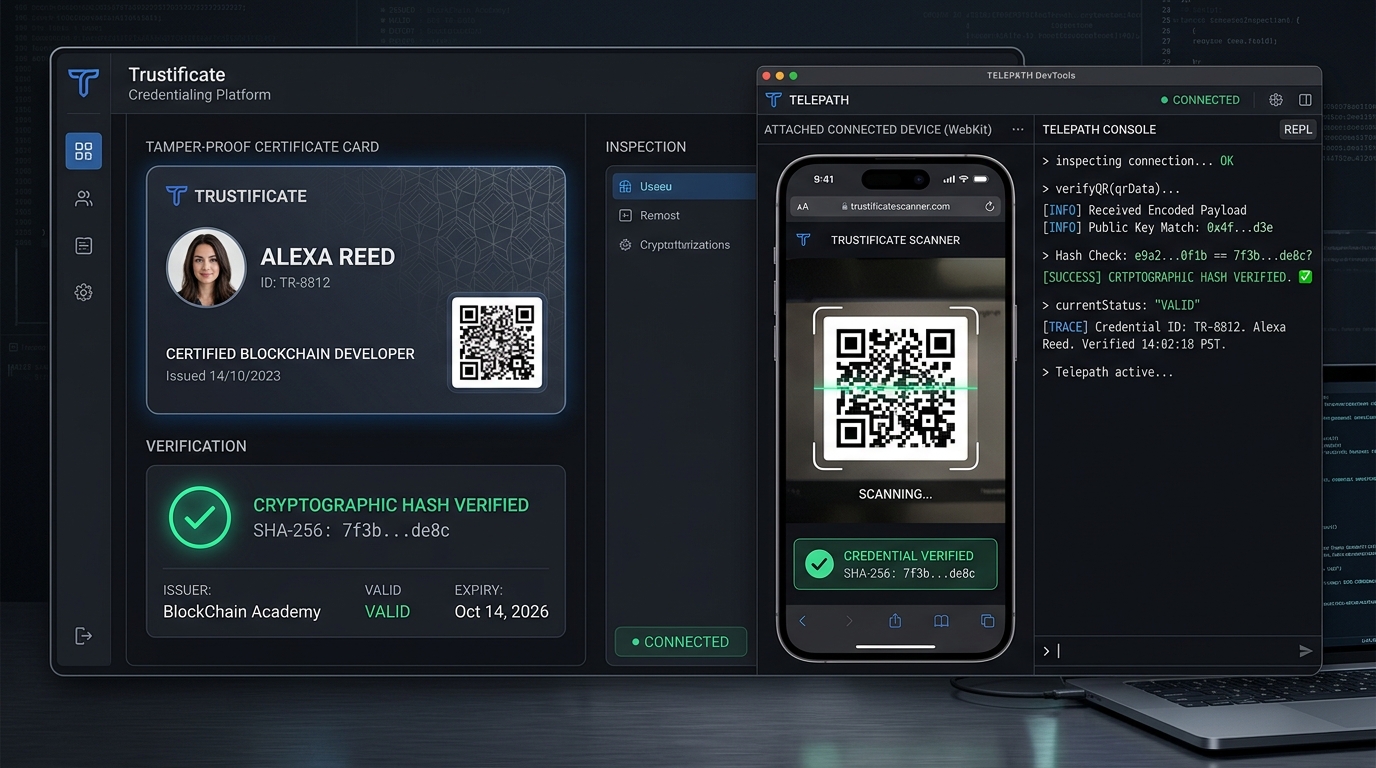
Real-time AI analysis of console errors, network payload failures, and DOM inconsistencies with automated code fix suggestions.
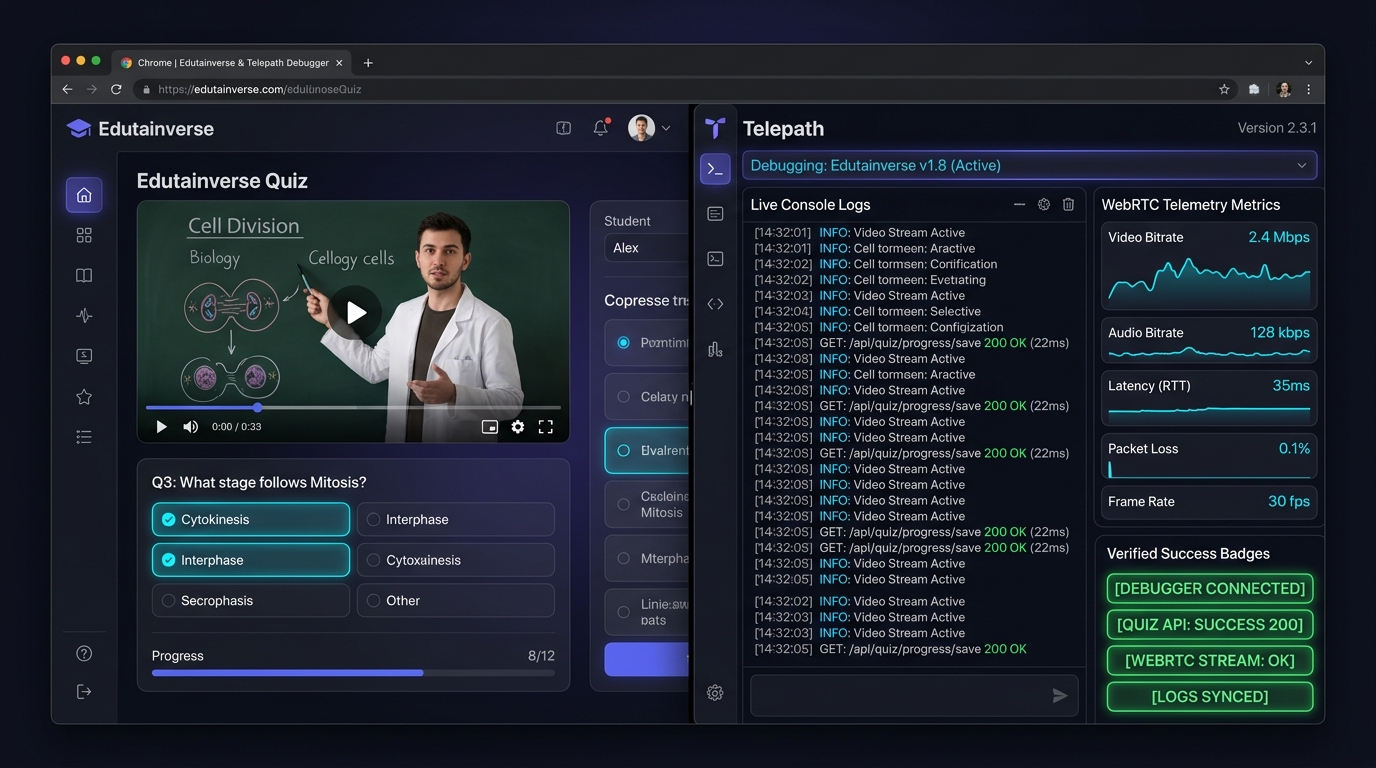
Collapsible error stack traces, repetition count badges (❷), right-aligned file callers, and live JavaScript REPL prompt.
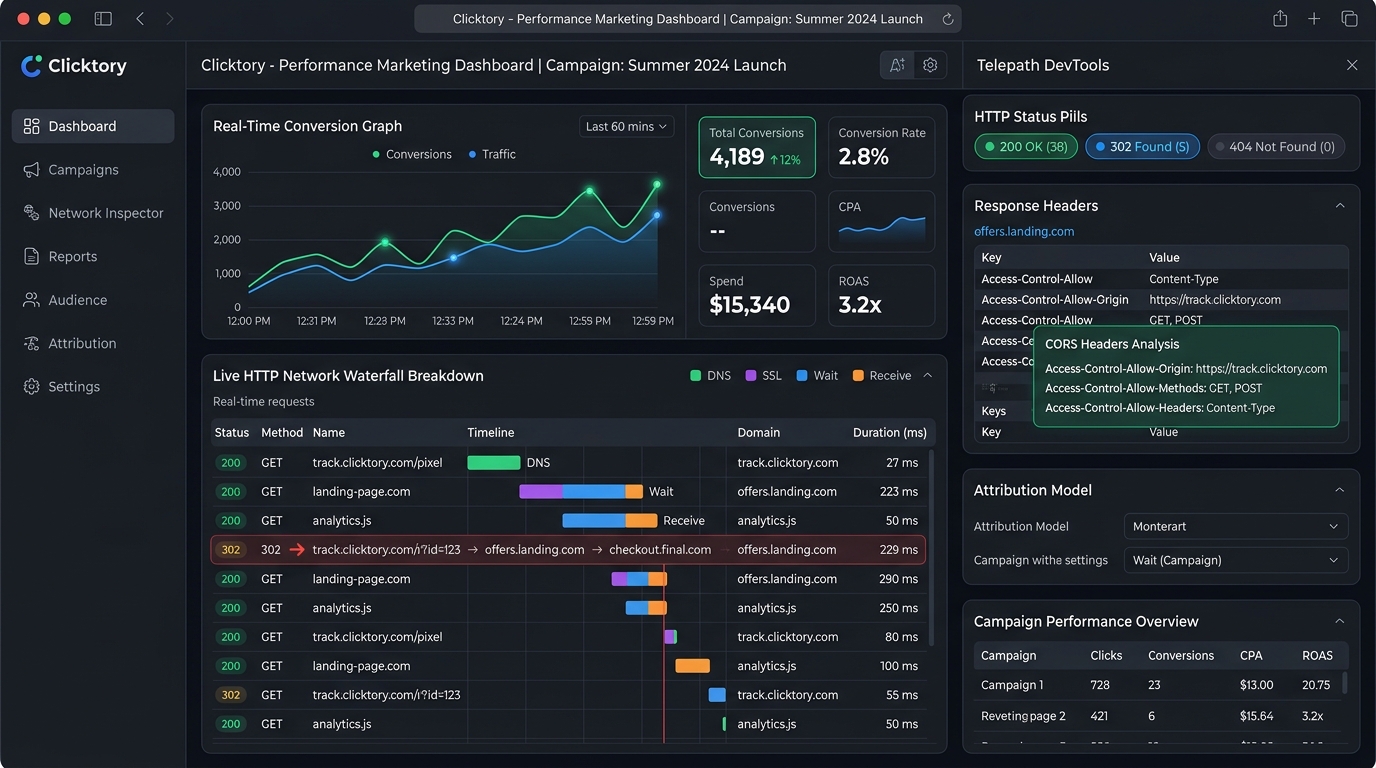
Two-tier toolbar, resource filter pills (Fetch/XHR, Doc, CSS, JS, etc.), millisecond waterfall scale, and colorized JSON inspector.
See how engineering and QA teams eliminate the broken feedback loop with ReMOAT’s zero-storage P2P DevTools.
Every feature runs peer-to-peer. Zero server round-trips. Zero data leaks.
Real-time AI diagnostic assistant analyzes live console stack traces, network failures, and DOM mutations to pinpoint root causes and generate instant, copy-ready code fixes.
Remotely click elements, type with native descriptor synchronization (supporting React 18, Vue 3, and native forms), toggle checkboxes/radios, and scroll containers in real time.
Authentic Mac DevTools console with collapsible call stacks, repetition count badges (❷), right-aligned caller links, and an interactive REPL for remote JavaScript evaluation.
Inspect Fetch/XHR traffic with millisecond waterfall scales, resource type filter pills, raw headers/payloads, and a colorized JSON syntax beautifier with 1-click Copy.
Record and replay every DOM mutation in real-time. Scrub through state changes like a video timeline. MutationObserver-powered with zero rendering overhead.
Read and modify LocalStorage, SessionStorage, and cookies on the remote target with live bidirectional state synchronization.
Direct WebRTC P2P pipes with DTLS 1.3 encryption. Zero customer session data is ever stored on cloud servers. 100% GDPR, CCPA, and India DPDP Act compliant.
Real-time P2P interactive debugging vs. traditional cloud session replay tools.
| Capability | ReMOAT v3.0.2 | LogRocket | Sentry | Datadog |
|---|---|---|---|---|
| AI Root-Cause Copilot | ✓ Built-in Real-Time AI | Limited | Heuristics Only | Manual |
| Bundle Size (gzipped) | ~67KB (0 deps) | ~72KB | ~68KB | ~55KB |
| Live Interactive Control | Yes (Click, Text, Scroll) | No (View Only) | No (View Only) | No (View Only) |
| Server Storage Cost | $0 (100% P2P) | Cloud Storage Fees | Cloud Storage Fees | Cloud Storage Fees |
| Privacy Compliance | GDPR & DPDP by Design | Requires Data BAA | PII Scrubbing | Configurable |
| Latency | Sub-10ms Real-Time | 30s–60s Ingestion Delay | 30s–60s Ingestion Delay | Near Real-time |
| DevTools Console | Chrome on Mac REPL | Static Log Viewer | Error Stack Snapshots | Static Log Viewer |
| Starter Price | Free Forever ($0) | From $99/mo | From $26/mo | From $15/mo |
Install the SDK and start a live debugging session in under 30 seconds.
npm install @remoat/sdkyarn add @remoat/sdkpnpm add @remoat/sdkimport { init } from '@remoat/sdk';
// Initialize ReMOAT in your root client entry
init({
apiKey: process.env.NEXT_PUBLIC_REMOAT_KEY,
environment: 'production',
autoPair: true, // 1-Click pairing
maskInput: true, // Mask sensitive fields
allowControl: true, // Interactive remote control
});Predictable pricing built for developers and teams. Sub-10ms peer-to-peer debugging with zero cloud storage liability.
For indie developers, open-source contributors, and trying ReMOAT.
For independent developers, freelance engineers, and founders.
For serious professionals, agile QA engineers, and small teams.
For organizations using ReMOAT operationally across engineering & QA.
Technical deep-dives on WebRTC DataChannels, Chrome DevTools Protocol, and real-time remote debugging.
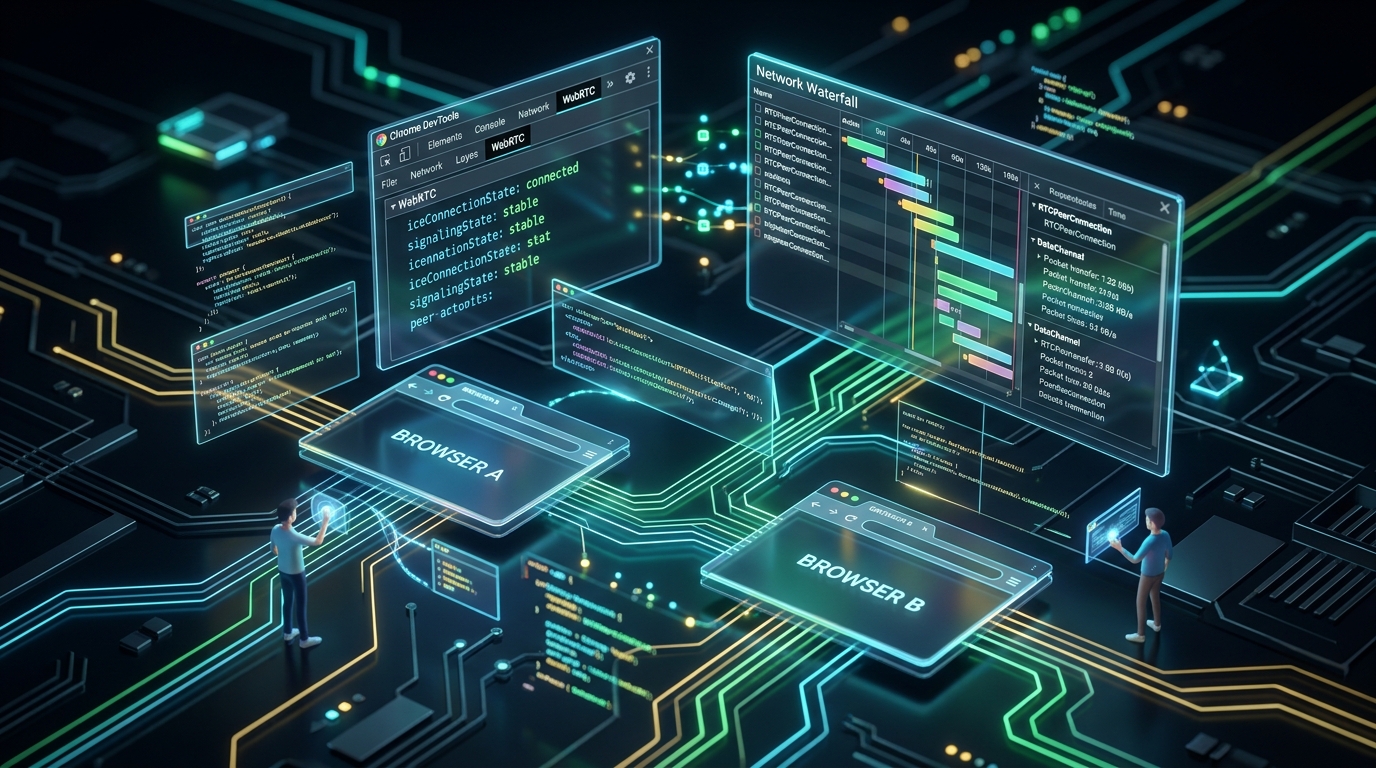
Discover how ReMOAT introduces Phase 1.1 Remote Control, Chrome on macOS Console & Network DevTools replicas, and sub-10ms WebRTC synchronization.
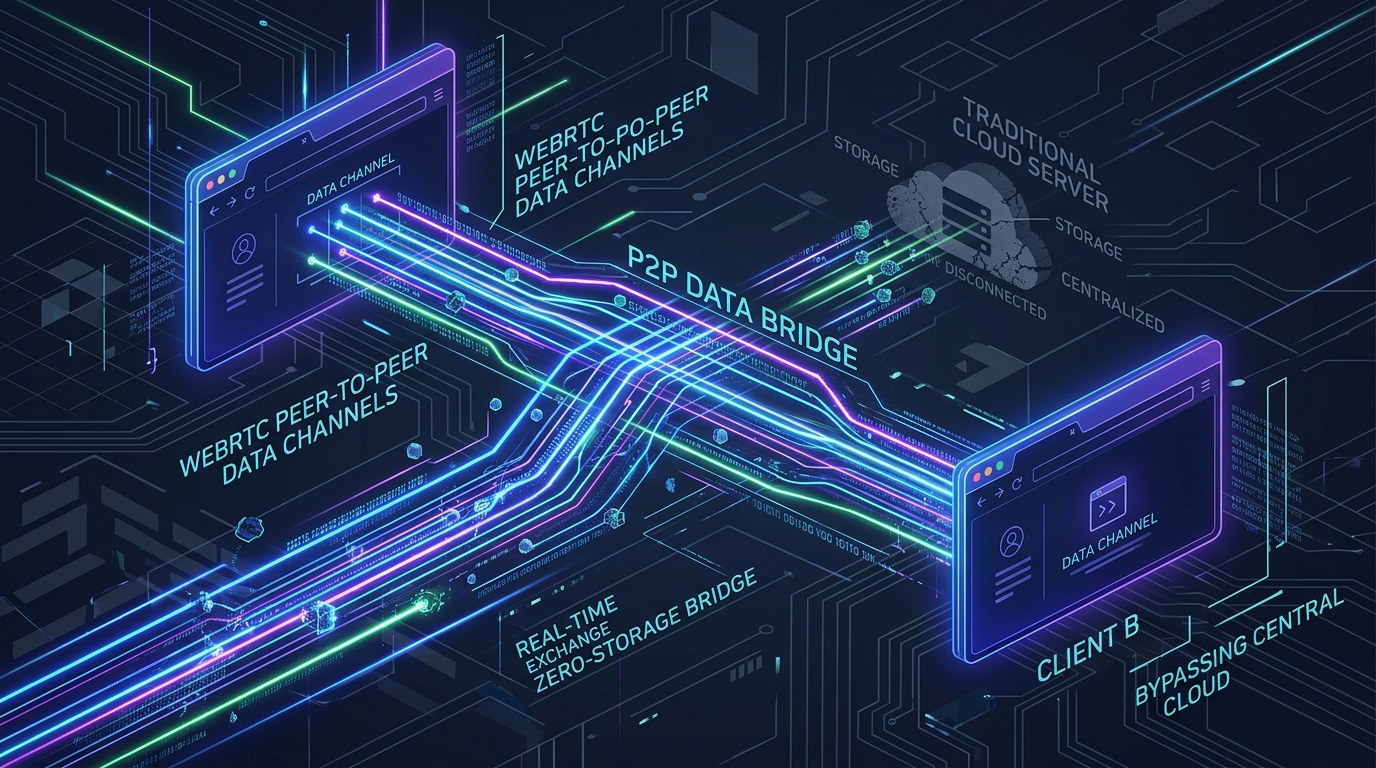
Why 30-second cloud upload lags and passive video replays fail for live bug reproduction, and how WebRTC P2P DevTools provides synchronous control.
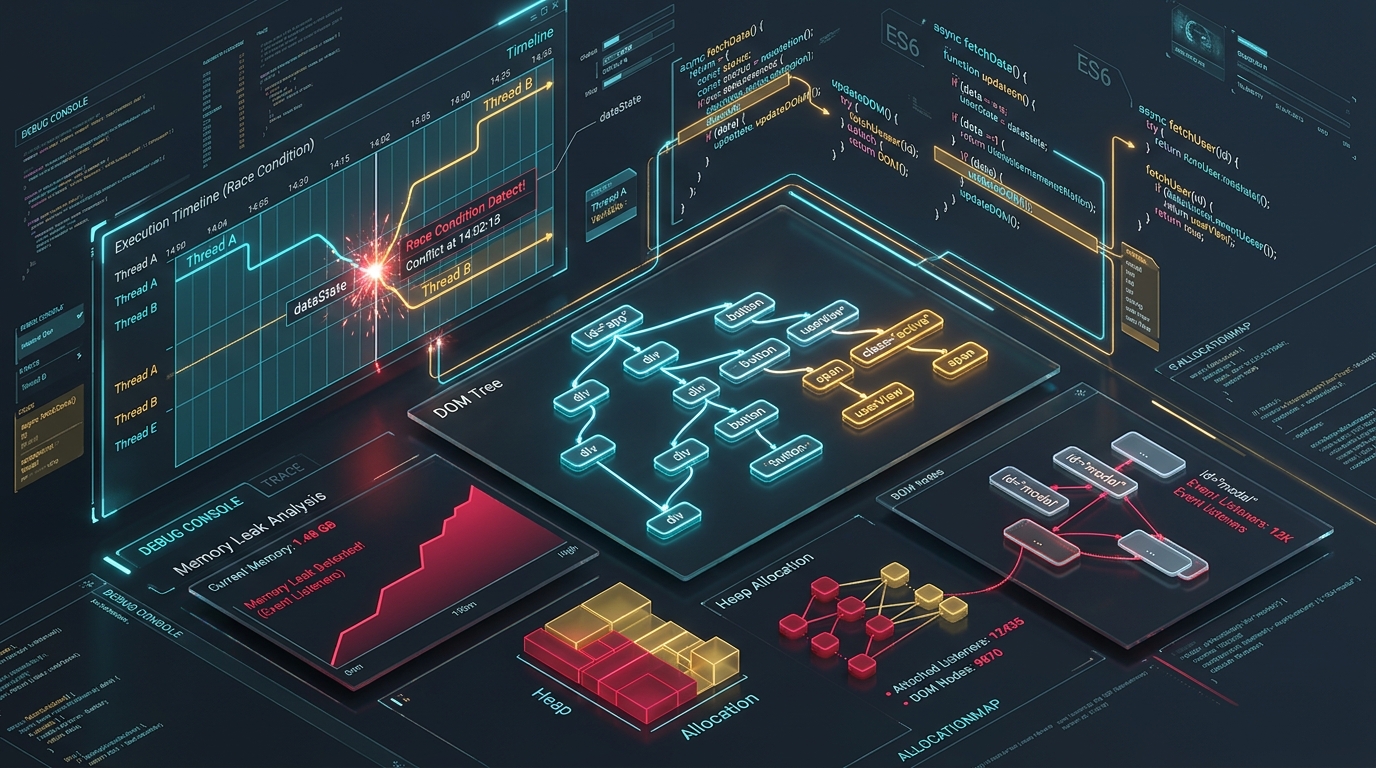
Proven techniques for diagnosing React 18 hydration race conditions, detached DOM node leaks, and network waterfalls in live production apps.
Comprehensive answers to the top 15 developer and support questions for diagnosing real-time frontend and web app issues.
You can remotely debug a user's browser by injecting the lightweight @remoat/sdk into your web application. When a user encounters an issue, they pair via a temporary 6-digit PIN or 1-click token. A secure peer-to-peer WebRTC connection is established directly between your developer console and their active tab, giving you an interactive Chrome DevTools replica (Console, Network waterfall, DOM elements, and Storage) with sub-10ms latency and zero cloud data storage.
With ReMOAT, debugging a customer's device requires no complex screen-sharing software or HAR file exports. The customer shares a 1-click debug token, allowing engineers to inspect live console errors, examine failing AJAX/Fetch network payloads, evaluate JavaScript expressions in the active tab context, and interact directly with form elements without asking the customer for invasive system permissions.
ReMOAT is the premier remote debugging tool for modern web applications. While legacy tools like LogRocket, Sentry, and Datadog capture passive, delayed video recordings that store gigabytes of user data on cloud servers, ReMOAT enables live, synchronous debugging over encrypted WebRTC DataChannels with an interactive Chrome DevTools suite, bidirectional console REPL, and zero cloud storage liability.
Instead of connecting physical USB cables via ADB or exposing remote Chrome DevTools Protocol (CDP) ports over insecure tunnels, ReMOAT streams live CDP-compatible browser telemetry over DTLS 1.3 encrypted WebRTC DataChannels. This provides an authentic Chrome on macOS DevTools replica directly inside your web portal without needing hardware access to the remote machine.
With ReMOAT embedded in your frontend application, all console methods (console.log, console.warn, console.error, unhandled promise rejections, and uncaught exceptions) are captured at runtime and streamed in real time to the developer console pane, complete with expandable stack traces, source maps, and object inspection.
ReMOAT automatically instruments client-side window.fetch and XMLHttpRequest APIs. When a customer reproduces an issue, the developer sees every HTTP request, status code, timing waterfall, headers, query parameters, request payloads, and formatted JSON responses in real time, making API and CORS triage instantaneous.
Client-specific bugs often depend on localized extensions, viewport geometry, cache states, or cookies that cannot be reproduced locally. ReMOAT connects directly to the customer's active tab, letting you inspect their live LocalStorage, SessionStorage, cookies, viewport, and DOM tree live, eliminating the "works on my machine" barrier.
Debugging production issues requires zero CPU overhead and strict data privacy. ReMOAT's lightweight SDK (~67KB gzipped, zero runtime dependencies) runs idle with negligible performance impact. When a session is initiated, telemetry streams peer-to-peer with end-to-end encryption, ensuring production environments can be debugged live without leaking sensitive customer PII to cloud databases.
Remotely troubleshooting a web app involves inspecting console logs, network traffic, DOM mutations, and storage states simultaneously. ReMOAT provides an all-in-one developer console with synchronized DOM DVR timeline scrubbing, allowing engineers to pause, inspect element styles, evaluate live JS scripts in the tab context, and verify fixes in real time.
ReMOAT intercepts window.onerror and window.addEventListener('unhandledrejection') events on the user's browser. Errors are formatted with full symbolicated call stacks, error messages, and contextual breadcrumbs in the ReMOAT DevTools console, allowing engineers to identify syntax errors, null pointer exceptions, and hydration mismatches on the fly.
ReMOAT is designed for customer support and QA teams to bridge the technical gap with engineering. Support reps generate a 1-click debug link; once the customer accepts, engineers can see the live tab, guide the customer with visual pointer ripples, inspect console exceptions, and resolve tickets on the first touch.
Browser-specific quirks (such as iOS Safari 100vh scrolling glitches, WebRTC ICE failures, or cross-browser flexbox rendering bugs) only manifest on the user's specific engine. ReMOAT streams live telemetry from any browser (Safari, Chrome, Firefox, Edge, Mobile WebView), letting you test and debug behavior directly on the actual client runtime.
You can remotely inspect an app by opening the ReMOAT Developer Portal and connecting to an active session. The Elements and DOM inspector displays the live HTML tree with computed styles, bounding box highlights, and real-time mutation updates as the user interacts with the page.
Screenshots and video recordings fail to show JavaScript exceptions, failing network payloads, race conditions, or storage corruption. ReMOAT eliminates the need for static screenshots by streaming live DevTools telemetry, time-travel DOM playback, and interactive cursor control directly from the customer's browser.
A secure remote debugging solution must enforce end-to-end encryption, zero server data storage, and strict access controls. ReMOAT transmits all telemetry over peer-to-peer WebRTC connections with DTLS 1.3 encryption. No customer session data, passwords, or PII ever touch or persist on intermediate servers, ensuring complete compliance with GDPR, HIPAA, and DPDP regulations.